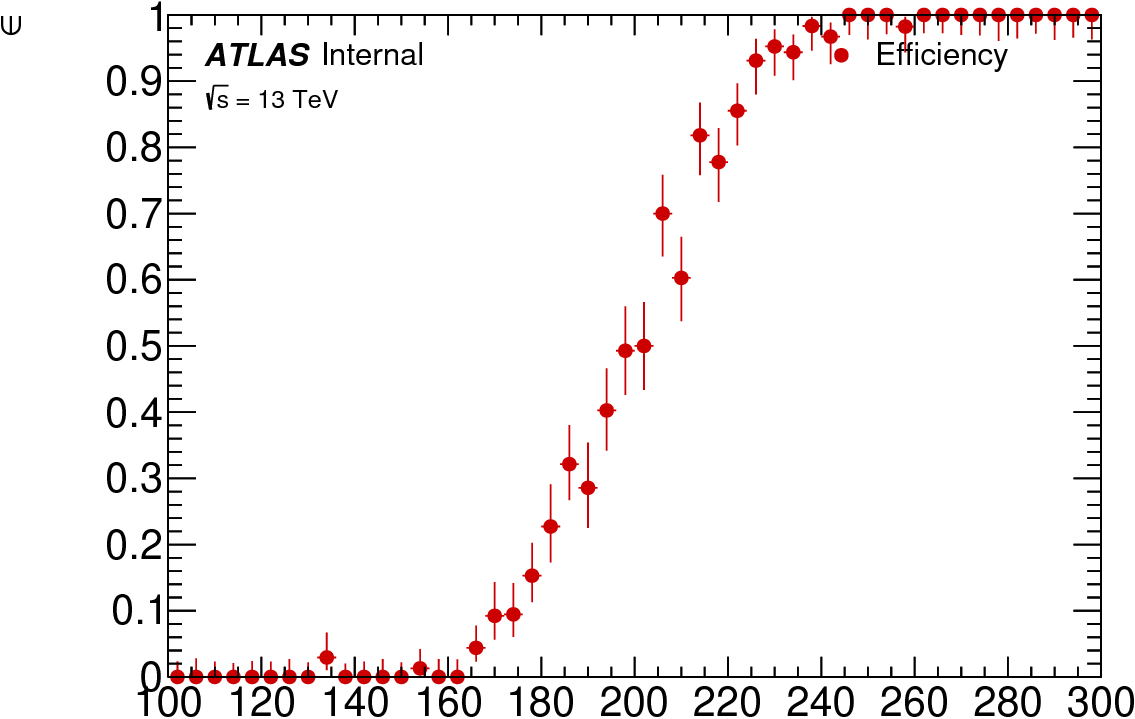
MPF.efficiencyPlot module
Plot the ratio of histograms where the numerator is assumed to be filled with a subset of the events of the denominator.
The first registered histogram is the denominator, all further histograms are treated as numerators.
Example
#!/usr/bin/env python

import ROOT
from MPF.efficiencyPlot import EfficiencyPlot
from MPF.atlasStyle import setAtlasStyle

setAtlasStyle()

passed = ROOT.TH1F("passed", "", 50, 100, 300)
total = ROOT.TH1F("total", "", 50, 100, 300)
passed.Sumw2()
total.Sumw2()
for i in range(10000):
    val = ROOT.gRandom.Gaus(100, 200)
    shift = ROOT.gRandom.Gaus(0, 20)
    total.Fill(val)
    if (val+shift) > 200:
        passed.Fill(val)

p = EfficiencyPlot(ratioMode="bayes")
p.registerHist(total)
p.registerHist(passed, legendTitle="Efficiency")
p.saveAs("plot.pdf")
-
class
MPF.efficiencyPlot.EfficiencyPlot(ratioTitle='Data / MC', **kwargs)[source]¶ Bases:
MPF.plotStore.PlotStoreParameters: - doDataMCRatio – if both data and MC is added, also plot the data/MC ratio (default: False)
- ratioModeDataMC – ratioMode if data/MC is to be drawn default: “hist”
- ratioTitle – Title for the ratio pad if data/MC ratio is shown (default: “Data / MC”)
Overwrites the defaults for the following
PlotStore()parameters:Parameters: - ratioMode – default: “binomial”
- drawRatioLine – default: False
- yTitle – default: #epsilon
For further options see
PlotStore()-
registerHist(hist, **kwargs)[source]¶ Overwrites the defaults for the following
registerHist()parameters:Parameters: - hide – default: True
- style – default: “signal”
- markerStyle – default: 20
For further options see
registerHist()
-
saveAs(path, **kwargs)[source]¶ Save the canvas. Arguments are passed to
MPF.canvas.Canvas.saveAs()