MPF.signalRatioPlot module
Overlay multiple histograms (added with style “signal”) and plot the ratio to the first one in the bottom pad.
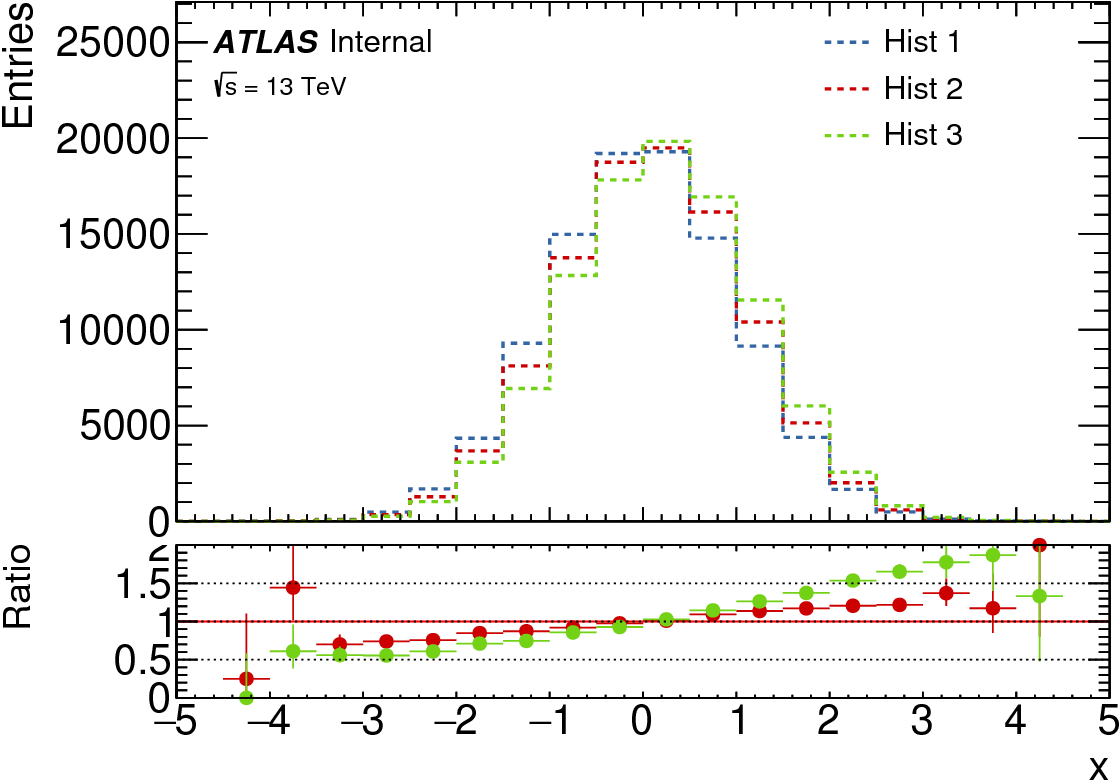
Example
#!/usr/bin/env python

import ROOT
from MPF.signalRatioPlot import SignalRatioPlot
from MPF.atlasStyle import setAtlasStyle

setAtlasStyle()
hist1 = ROOT.TH1F("hist1", "", 20, -5, 5)
hist2 = ROOT.TH1F("hist2", "", 20, -5, 5)
hist3 = ROOT.TH1F("hist3", "", 20, -5, 5)

hist1.FillRandom("gaus", 100000)
shiftGaus1 = ROOT.TF1("shiftGaus1", "TMath::Gaus(x, 0.1)")
hist2.FillRandom("shiftGaus1", 100000)
shiftGaus2 = ROOT.TF1("shiftGaus2", "TMath::Gaus(x, 0.2)")
hist3.FillRandom("shiftGaus2", 100000)

p = SignalRatioPlot(xTitle="x", ratioMode="pois")
p.registerHist(hist1, style="signal", process="Hist 1")
p.registerHist(hist2, style="signal", process="Hist 2")
p.registerHist(hist3, style="signal", process="Hist 3")
p.saveAs("plot.pdf")
-
class
MPF.signalRatioPlot.SignalRatioPlot(ratioTitle='Ratio', **kwargs)[source]¶ Bases:
MPF.plotStore.PlotStoreParameters: ratioTitle – default: “Ratio” Overwrites the defaults for the following
PlotStore()parameters:Parameters: - ratioUp – default: 2.
- ratioDown – default: 0.
- ratioMode – default: “pois”
- ignoreNumErrors – default: False
- ignoreDenErrors – default: False
For further options see
PlotStore()-
saveAs(path, **kwargs)[source]¶ Save the canvas. Arguments are passed to
MPF.canvas.Canvas.saveAs()