MPF.plotStore module
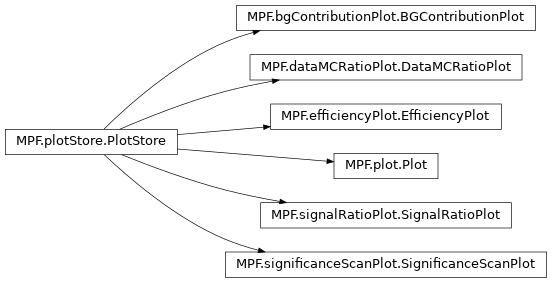
All plots inherit from the PlotStore.
To make a plot, create an instance of one of the plot classes:
from MPF.plot import Plot

plot = Plot()
Most options concerning the plot and its style are set when the plot is instanciated:
plot = Plot(logy=True, yMin=1e-5, yMax=1e5)
See PlotStore() for a list of all options.
Then use registerHist() to register
ROOT histograms to
the plot:
plot.registerHist(hist1, style="background", process="Bkg1")
The basic “styles” are background, signal and data. Background histograms will be added to a ROOT THStack, each signal is overlaid as a separate histogram and data is drawn as black dots with error bars. If multiple histograms are added for the same process name they are added up.
Finally the plot can be drawn using saveAs():
plot.saveAs(outputFilename)
The output format is determined by the filename extension.
-
class
MPF.plotStore.PlotStore(splitting=None, atlasLabel='Internal', infoLabel=None, processLabel=None, targetLumi=None, centerOfMassEnergy=13, xTitle=None, yTitle=None, binLabels=None, unit=None, debugText=None, customTexts=None, lowerCut=None, upperCut=None, ratioUp=1.75, ratioDown=0.25, ignoreNumErrors=False, ignoreDenErrors=False, ratioMode='pois', drawTotalBGError=True, drawTotalBGErrorLegend=False, drawRatioArrows=True, drawRatioBkgErrorBand=True, drawRatioLine=True, addOverflowToLastBin=False, addOverflowBinNote=False, yMin=None, yMax=None, xAxisLabelsOption=None, logy=False, insideTopMargin=0.25, normStack=False, sortStackByIntegral=True, raptorFunction=None)[source]¶ Bases:
objectStore histograms and provide basic utilities to be implemented by plot classes
Some plots (with example code):
Plot()DataMCRatioPlot()BGContributionPlot()SignificanceScanPlot()SignalRatioPlot()EfficiencyPlot()
Parameters: - splitting – will be passed to
Canvas() - atlasLabel – Text next to “ATLAS” (set None to deactivate)
- infoLabel – Text underneath the lumiLabel/CMELabel (set None to deactivate)
- processLabel – If not set to None a label with this process will be created
- targetLumi – If not set to None a label with this integrated luminosity will be created
- centerOfMassEnergy – If not set to None a label with this center of mass energy will be created
- xTitle – will be assigned to all histograms added by
registerHist() - yTitle – y-Axis title for the main pad
- binLabels – will be assigned to all histograms added by
registerHist() - unit – will be assigned to all histograms added by
registerHist() - debugText – Take list of lines and adds them to the main pad (might be deprecated soon)
- customTexts – Take list of tuples with (xpos, ypos, text) and adds them as TLatex labels to the plot
- lowerCut – print a line for the lower cut
- upperCut – print a line for the upper cut
- ratioUp/ratioDown – y-axis limits in ratio plots
- ignoreNumErrors – ignore numerator errors in ratio plots
- ignoreDenErrors – ignore denominator errors in ratio plots
- ratioMode – how to calculate the ratio and the errors (see
getRatioHistogram()for possible options) - drawTotalBGError – draw the error of the total bkg
- drawTotalBGErrorLegend – draw the error of the total bkg in the legend
- drawRatioArrows – draw arrows in ratio plots
- drawRatioBkgErrorBand – draw error band in ratio plots that indicates the denominator errors
- drawRatioLine – draw a line at 1 in ratio plots
- addOverflowToLastBin – Merge the overflow bin and the last bin which is plotted
- addOverflowBinNote – Add a text that informs if the overflow was added to the last bin
- yMin – Minimum on the mainpad y-Axis
- yMax – Maximum on the mainpad y-Axis
- xAxisLabelsOption – Pass option to the x-Axis labels (e.g. “v” for vertical labels) cf. ROOT TAxis::LabelsOption
- logy – Set Log scale on the mainpad y-Axis
- insideTopMargin – Inside top margin in the mainpad (between histograms maximum and the top - relativ to canvas size)
- sortStackByIntegral – If set to false the histograms will be stacked in the order they are registered
- normStack – Normalise background stack to total Integral
- raptorFunction – (Experimental) - Execute this function before saving the canvas (gets plotStore as parameter). You should return all the stuff that should not get out of scope or garbage collected
For setting options for the legend and labels see:
setLegendOptions()setATLASLabelOptions()setCMELabelOptions()setLumiLabelOptions()setProcessLabelOptions()setInfoLabelOptions()
-
addCumulativeStack(pad, **kwargs)[source]¶ Adds cumulative distributions for all backgrounds and signals to the given pad. The kwargs are passed to getCumulativeStack
-
addSignalRatios(pad, style='signal', addLegend=False, register=False, applyRatioLimits=True)[source]¶ Create multiple ratio histograms/graphs and add them to the given pad. Uses
getRatioHistogram()(options are set viaPlotStore())Parameters: - pad – Add the ratios to this pad.
- style – Create ratios for all histograms of this style
- addLegend – add legend entries for the ratios
- register – register the ratio histograms to the plot (useful for creating data/mc ratio)
- applyRatioLimits – apply the ratioUp, ratioDown parameters to the given pad
-
addSignificanceScan(pad, processesOfInterest=None, scanDirection='forward', **kwargs)[source]¶ Adds a significance scan for each signal in the given pad. The kwargs are passed to getSignificanceHistogram
-
static
getCumulativeStack(*hists, **kwargs)[source]¶ Create a stack of cumulative histograms. If only one hist is given, no stack is created (one cumulative histogram instead)
Parameters: - hists – Histograms to be stacked
- forward – Integrate to the right? (default: True)
-
getRatioHistogram(num, den, drawArrows=True, mode='rawpois', ignoreDenErrors=True, ignoreNumErrors=False)[source]¶ create a ratio histogram.
Parameters: - num – numerator histogram
- den – denominator histogram
- drawArrows – draw Arrows when the ratio points reach out of the pad
- mode – Mode for calculating the ratio (see options listed below)
- ignoreDenErrors – Ignore the denominator errors
- ignoreNumErrors – Ignore the numerator errors
The following modes are available:
- “rawpois” (default) : Use the raw yield to calculate poisson errors
- “pois” : Use ROOT TGraphAsymmErrors::Divide with option pois
- “hist” : Use ROOT TH1::Divide
-
static
getSignificanceHistogram(signal, background, mode='BinomialExpZ', customFunction=None, forward=True, overrideLineStyle=None)[source]¶ Create histogram which shows for each bin the significance when cutting on the value on the x-axis.
Parameters: - mode – mode for signficance calculation:
- customFunction – if given, use this function for significance calculation (takes s, b, db and returns z)
- forward – integrate to the right? (default: True)
Possible significance modes (in both cases the total bkg uncertainty is taken from the histogram):
- BinomialExpZ: Binomial Significance using RooStats::NumberCountingUtils::BinomialExpZ
- PoissonAsimov: using the significance based on asymptotic profile likelihood with poisson constraint (see http://www.pp.rhul.ac.uk/~cowan/stat/medsig/medsigNote.pdf)
- PoissonAsimovCLs: same assumptions as PoissonAsimov, but applied for CLs (exclusion) - see
getExpCLsAsimov()
-
registerHist(hist, style='signal', drawString='', process='', legendTitle=None, drawLegend=True, hide=False, lineStyle=None, lineWidth=None, fillStyle=None, markerStyle=None, color=None, lineColor=None, fillColor=None, markerColor=None, drawErrorBand=False, maskBins=None, xTitle=None, unit=None, ratioDenominatorProcess=None, stackOnTop=False)[source]¶ Add histogram to plot
Parameters: - hist – ROOT histogram
- style – Possible values: “signal”, “background”, “data”
- drawString – Custom drawing option for this histogram (see ROOT THistPainter)
- process – Label this histogram with a process name
- legendTitle – Custom legend title (if not given, process label is used)
- drawLegend – Set to false if no legend should be drawn for this process
- hide – Don’t explicitely draw this histogram and don’t include it in the legend
- lineStyle – ROOT line style for this histogram
- lineWidth – ROOT line width for this histogram
- fillStyle – if given use this fill style instead of the predifined one (see ROOT::TAttFill)
- markerStyle – if given use this marker style (for data) instead of the predifined one (see ROOT::TAttMarker)
- color – can be given as a ROOT TColor enum or as a
string (see
rootStyleColor()) - lineColor – set this if you want a different color for the line
- fillColor – set this if you want a different color for the filled area
- markerColor – set this if you want a different color for the marker
- drawErrorBand – draw an errorband in the style of the usual total background error for this process
- maskBins (list) – truncate these bins (by bin numbers)
- xTitle – x-Axis title (overwriting what is in the ROOT histogram)
- unit – if given it will be shown both on x and y Axis
- ratioDenominatorProcess – if multiple ratios are to be drawn use the histogram with the given process name as denominator
- stackOnTop – stack this histogram on top of the total background (even if it is a signal)
-
saveAs(path, **kwargs)[source]¶ Save the canvas. Arguments are passed to
MPF.canvas.Canvas.saveAs()
-
setATLASLabelOptions(*args, **kwargs)[source]¶ Set the options to be passed to
ATLASLabel()
-
setCMELabelOptions(*args, **kwargs)[source]¶ Set the options to be passed to
CMELabel()
-
setInfoLabelOptions(*args, **kwargs)[source]¶ Set the options to be passed to
InfoLabel()
-
setLumiLabelOptions(*args, **kwargs)[source]¶ Set the options to be passed to
LumiLabel()
-
setProcessLabelOptions(*args, **kwargs)[source]¶ Set the options to be passed to
ProcessLabel()