MPF.treePlotter module
Interface to generate plots (see plotStore) directly from ROOT TTrees.

Options for plotting can already be set when the
TreePlotter is initialised. They will
serve as defaults for any plot that doesn’t set these options:
from MPF.treePlotter import TreePlotter

tp = TreePlotter(cut=myCut, weight=myWeight)
All options that don’t correspond to
TreePlotter or
ProcessProjector will be passed to
the plot (plotType) that is created in the end.
Defaults can also be changed at any time by calling
setDefaults().
Before creating plots, add several processes to it:
tp.addProcessTree(processName, treePath, treeName)
All further options are passed to Process() - to
be used later for registerHist().
You can also explicitely create the Process()
and add it. By doing so you can assign multiple trees in multiple
files to one process:
from process import Process

p = Process(processName)
p.addTree(treePath1, treeName1)
p.addTree(treePath2, treeName2)
tp.addProcess(p)
Finally plots are created by calling plot():
tp.plot(outputName)
Further options will overwrite the default ones for this particular plot.
Instead of running plot()
you can also run registerPlot()
to create all plots at once later with
plotAll(). This will use
multiHistDrawer by default to loop over each tree only
once. For example:
tp.registerPlot(outputFilename1, varexp=var1, xmin=xmin1, xmax=xmax1, nbins=nbins1)
tp.registerPlot(outputFilename2, varexp=var2, xmin=xmin2, xmax=xmax2, nbins=nbins2)
tp.plotAll()
Example
#!/usr/bin/env python
import os
import ROOT
from MPF.examples import exampleHelpers
from MPF.treePlotter import TreePlotter
from MPF.process import Process
testTreePath = "/tmp/testTreeMPF.root"
if not os.path.exists(testTreePath):
exampleHelpers.createExampleTrees(testTreePath)
# Default Options can already be set when the plotter is initialized
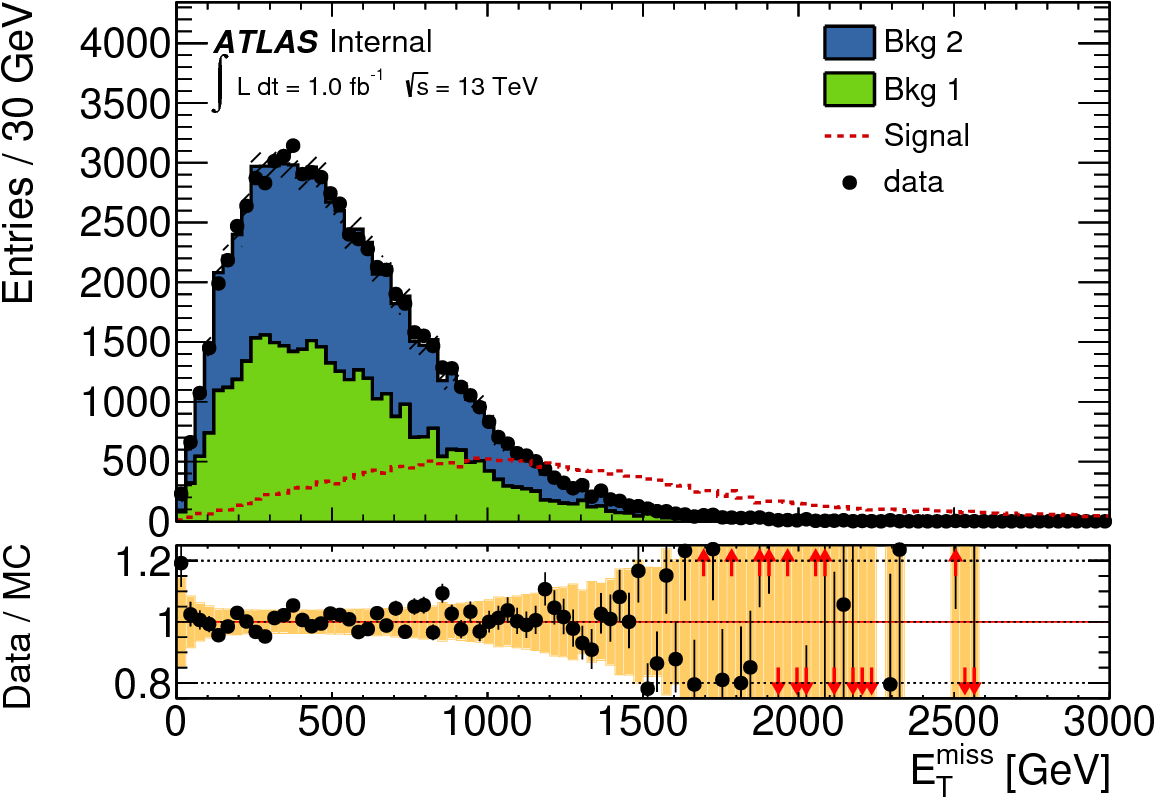
tp = TreePlotter(cut="ht>1000", varexp="met", xTitle="E_{T}^{miss}", unit="GeV", plotType="DataMCRatioPlot")
# Processes and their corresponding trees can be added via addProcessTree
tp.addProcessTree("Bkg 2", testTreePath, "w2", style="background")
tp.addProcessTree("Signal", testTreePath, "w4", style="signal")
# Processes can have custom cuts that are only applied for them
# Here we use this to scatter the background a bit, so our "data"
# which will be in the end from the same tree looks a bit more
# different ;)
tp.addProcessTree("Bkg 1", testTreePath, "w1", cut="(1-50*(1-w))", style="background")
# If multiple trees/files correspond to one process then you can
# explicitely create the Process object and add it to the plotter
data = Process("data", style="data")
data.addTree(testTreePath, "w1")
data.addTree(testTreePath, "w2")
tp.addProcess(data)
# options given to plot are only valid for the particular plot (and temporarily can overwrite the defaults)
tp.plot("plot.pdf", xmin=0., xmax=3000, nbins=100, ratioUp=1.25, ratioDown=0.75)
-
class
MPF.treePlotter.TreePlotter(**kwargs)[source]¶ Bases:
MPF.processProjector.ProcessProjectorGenerate plots from trees
Parameters: - plotType – Name of the Plot class to be created - see
PlotStore()for a list - legendOptions – dictionary of options to be passed to
legend() - globalStyle – Dictionary of
globalStyleoptions that should be used for the plots
You can pass
ProcessProjectorarguments:Parameters: - cut – Cut expression to be applied for all registered processes (default: “1”)
- weight – Weight expression to be applied for all registered processes (default: “1”)
- varexp – Expression to be used for filling histograms (default: “1”)
- inputLumi – luminosity the trees are normalised to
- targetLumi – luminosity the histograms should be scaled to
- xmin – minimum on the x axis
- xmax – maximum on the x axis
- nbins – number of bins
- binLowEdges – list of low edges of bins (in this case xmin, xmax and nbins are ignored)
- useMultiHistDraw – use
multiHistDrawer()when callingfillHists()(loop tree only once and fill all histograms) (default: True) - cutsDict – if this is given, fetch only yields for all cuts and create a histogram and yieldsDict for each process
All further arguments are passed to
PlotStore()(or the plot class you are creating by plotType)All parameters can also be set when calling
plot()orregisterPlot()- in that case they are only valid for this particular plot and temporarily overwrite the defaults. The defaults can be also overwritten by callingsetDefaults()-
addProcessTree(name, filename, treename, **kwargs)¶ Create and add a process from one tree in one file. The kwargs are passed to
Process():Parameters to be used for
registerHist()for histograms created from the process:Parameters: - style – (default: “background”)
- color – (default: None)
- lineColor – (default: None)
- markerColor – (default: None)
- fillColor – (default: None)
- lineStyle – (default: None)
- lineWidth – (default: None)
- fillStyle – (default: None)
- markerStyle – (default: None)
- drawErrorBand – (default: False)
- drawString – (default: None)
- legendTitle – (default: None)
- drawLegend – (default: True)
- ratioDenominatorProcess – (default: None)
- stackOnTop – (default: False)
The other parameters:
Parameters: - cut – cut/weight expression to be used only for this process
- norm – normalise the resulting histograms to unity?
- scale – scale resulting histogram by this factor
- varexp – use this varexp for this process instead of the one used for all the other processes
- normToProcess – normalise the histogram to the same
integral as the given process (by name) before plotting (only
used for hists of style “systematic” in
TreePlotter) - sysTag – name of the systematic variation (mainly for internal use in
ProcessProjectorandTreePlotter) - noLumiNorm – don’t normalise this process to the luminosity configured
-
addSysTreeToProcess(nomProcessName, sysName, filename, treename, **kwargs)¶ Create and add a process from one tree in one file and register it as a systematic variation for the nominal process. The kwargs are passed to
Process()Parameters: - nomProcessName – name of the nominal process
- sysName – name of the systematic variation
- treename – name of the tree
- filename – path to the rootfile containing the tree
- normToProcess – normalise the histogram to the same
integral as the given process (by name) before plotting (only
used in
TreePlotter).
-
defaults= {'legendOptions': None, 'plotKwargs': None, 'plotType': 'Plot'}
-
fillHists(opt=None)¶ Project histograms for all processes
Parameters: opt – if given use these options instead of the current ones (see getOpt())
-
fillHistsSysErrors()¶ Adds errors based on variational histograms for all processes to their histograms. Should only be used if variations are not correlated across different processes (e.g. don’t use it for
TreePlotter- there is a treatment included for this viaregisterSysHist())
-
fillYieldsDicts(opt=None)¶ Fill yields dicts from cutsDict
Parameters: opt – if given use these options instead of the current ones (see getOpt())
-
getHists(processName, *args, **kwargs)[source]¶ Retrieve all histograms from a previous call of
plotAll()for the given process name matching all the given optionsParameters: processName – name of the process Example:
tp.registerPlot("plot1.pdf", varexp="met", xmin=0, xmax=50)
tp.registerPlot("plot2.pdf", varexp="met", xmin=10, xmax=50)
tp.registerPlot("plot3.pdf", varexp="mt", xmin=0, xmax=150)
tp.plotAll()

# will give 2 hists
for hist in tp.getHists("bkg 1", varexp="met"):
    # do something with hist
    pass

# will give 1 hist
for hist in tp.getHists("bkg 1", varexp="met", xmin=0):
    # do something with hist
    pass

# will give 1 hist
for hist in tp.getHists("bkg 1", "plot3.pdf")
    # do something with hist
    pass
Note: This is a generator - if the options or process name match multiple histograms, all of them are yielded. If you are sure only one matches you can do:
hist = next(tp.getHists(processName, **myOptions))
-
getOpt(**kwargs)[source]¶ Get the namedtuple containing the current
ProcessProjector()options, updated by the given arguments.
-
getProcess(processName)
-
getProcesses(*selection)
-
plot(savename, **kwargs)[source]¶ Create the plot with the current options - updating with the given
TreePlotter()parameters. The plot will be saved as the given savename.In addition the following parameters can be given:
Parameters: noSave – Don’t save the plot and draw the Canvas()with the “noSave” option. The underlying plot can be accessed via TreePlotter.plotStore (default: False)
-
plotAll(useMultiHistDraw=True, compile=False)[source]¶ Finally create all registered plots
Parameters: - useMultiHistDraw – Use
MultiHistDrawer()to fill the histograms (default: True) - compile – When using
MultiHistDrawer()use the compile option (usually not recommended)
- useMultiHistDraw – Use
-
registerPlot(*args, **kwargs)[source]¶ Register a plot to be plotted later. The arguments corresponding to this plot will be stored and passed to
plot()when the plot is created
-
registerToProjector(*selection, **kwargs)¶ Register hists for each process to the histProjector (to be filled later with multiHistDraw).
Mainly for internal use in
registerPlot()andregisterHarvestList()Parameters: - opt – namedtuple containing
ProcessProjector()options - selection – only register processes of this style(s) (like “background”)
- opt – namedtuple containing
-
setDefaults(**kwargs)[source]¶ Update the defaults for the
TreePlotter()parameters
-
setProcessOptions(processName, **kwargs)¶ Change the options of an existing process - referenced by its name. Only change the given options, leave the existing ones
- plotType – Name of the Plot class to be created - see